
Have you ever thought that an LED显示屏 can change the way an entire factory operates? It is not just hanging there for good looks but a key weapon to truly make the workshop “speak” and the production process “transparent.”
Data, progress, quality, and equipment status are all on one screen, all in sight. Want to know how much “smartness” is hidden behind this screen? Read on.
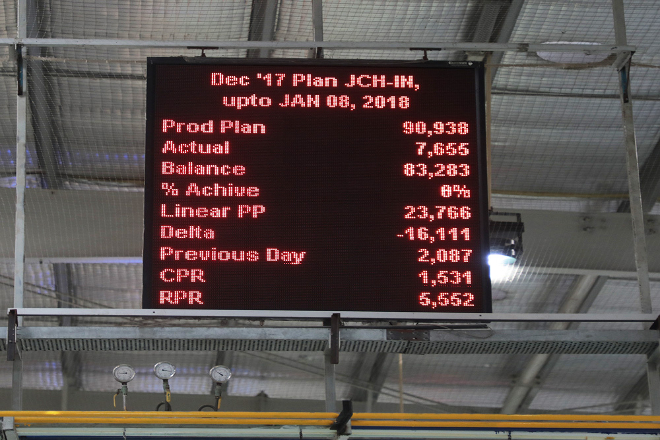
1). Visualization of production progress
In smart factories, the production progress is like a scoreboard for a game, which can be understood at a glance. The LED display screen is this “scoreboard.”
It can clearly show the comparison between the actual progress and the planned progress, such as in the form of a traffic light, green means normal progress, and red means that the progress is behind.
In this way, employees and managers can quickly know whether the production is “off track”.
If the progress of a certain link is slow, the manager can make adjustments immediately, such as adding more staff or optimizing the process to ensure that the production is completed on time.
This intuitive display method allows everyone to know the completion of their tasks and better cooperate with the overall production rhythm.
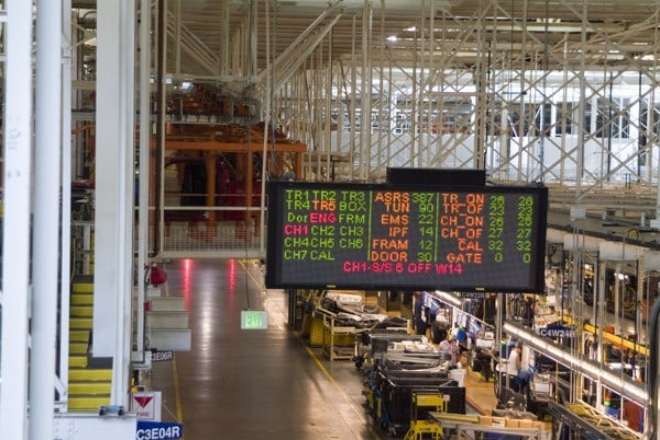
2). Equipment status monitoring
The equipment is the “big piece” of the factory. If it breaks down, the production will have to stop. The LED display is like the “health report” of the equipment, which can display the operating status of the equipment in real-time.
For example, the equipment will display green when it is operating normally, red when there is a fault alarm, and the maintenance status may be yellow.
Through this screen, the manager can clearly know whether the equipment is “sick” and where the fault is.
Moreover, the LED display can also update the equipment status in real-time, which makes it convenient for the manager to arrange the maintenance plan in advance to avoid a sudden “strike” of the equipment and affect production.
In this way, the maintenance of the equipment is more targeted, and the service life can be extended.
3). Quality data display
Quality is the “face” of the product, and no one wants to produce “defective products.” The LED display can help a lot in quality control.
It can display the results of the quality inspection in real-time, such as whether the product size, appearance, and other indicators are qualified.
If the test results show that there are quality problems, they will be directly marked on the screen, and employees and managers can see it at a glance.
This intuitive display method makes quality problems nowhere to hide, and timely measures can be taken to solve the problems, such as adjusting equipment parameters or retraining employees.
In this way, product quality is more guaranteed and customers are more satisfied.
4). Energy consumption monitoring
Energy consumption is the “hidden cost” of the factory. If there is more waste, the cost will go up. The LED display can monitor the factory’s energy consumption in real-time, such as the use of electricity, water, and gas.
Through the screen, managers can see the energy usage of each area. If they find that the power consumption in a certain area suddenly soars, they can immediately check the cause. Is it aging equipment or improper operation?
After finding the problem, measures can be taken to optimize energy use, such as adjusting equipment operating time or improving production processes.
In this way, the factory can not only save energy costs but also be more environmentally friendly.
5). Supply chain visualization
The supply chain is like the “supply line” of the factory. If the raw materials are not supplied, the production will be “stuck”.
The LED display can display the inventory and logistics status of raw materials, such as how much inventory is left and when the raw materials will arrive.
Through the connection with the supply chain system, the information on the screen will be updated in real time. When the purchasing staff sees that the inventory is insufficient, they can place an order in advance.
When the production department knows that the raw materials are about to arrive, they can arrange production in advance.
In this way, supply chain management is more transparent, production is smoother, and progress will not be delayed due to raw material shortages.
1). Data collection and integration
In order to make LED display screens truly “alive”, data is the key. Imagine that if the data is inaccurate or not updated in time, the LED display screen will become a “decoration”.
So, the first step is to get data collection.
This is like installing a bunch of “sensors” in the factory to capture important information such as equipment operation status, production progress, and quality inspection results.
For example, whether the equipment has any faults, how many production tasks have been completed, and whether the product quality is qualified, these data must be transmitted to the LED display screen in real-time.
But it is not enough to just collect data, and these data must be integrated. There are usually many systems in the factory, such as MES (manufacturing execution system) and ERP (enterprise resource planning system).
There are a lot of useful data hidden in these systems, but they may not know each other. Therefore, these systems and LED displays should be “connected” so that data can “run” freely between them.
For example, the production progress data in the MES system can be displayed on the LED screen in real-time, so that managers can see at a glance how the task is completed;
The inventory data in the ERP system can also be synchronized to remind purchasing staff to purchase goods. In this way, everyone in the factory can make decisions based on the latest data and will not be in a hurry because of information lag.
2). System design and customization
Each factory has its own “temperament”, so the content and layout of the LED display cannot be “one size fits all”. For example, a large factory may have several workshops, and each workshop produces different things.
At this time, multiple display screens can be designed, each of which specifically displays the data of a workshop.
In this way, managers and employees can quickly find the content they care about, and will not be “lost” because of too much information.
When designing, you must also consider how to highlight key information. For example, the production progress can be displayed with a very conspicuous progress bar. Green means normal progress and red means that the progress is behind schedule.
The status of the equipment can be represented by icons of different colors: green for normal operation, red for fault alarm, and yellow for maintenance.
Quality data can also be displayed with bar charts or line charts, such as the changing trend of the qualified rate is clear at a glance. Through these intuitive graphics, employees can see the key points at a glance even from a distance.
In addition, multi-level display content can be designed according to the complexity of the production process.
For example, the first layer shows the overall production overview, the second layer can go deep into the detailed data of a workshop or a production line, and the third layer can further display the specific information of a certain equipment or a certain process.
In this way, managers can not only grasp the overall situation but also front-line employees can pay attention to the specific tasks at hand.
3). Personnel training and management
With good tools, you have to know how to use them. Therefore, training for managers and employees is essential.
Training is not simply teaching them how to operate the display screen, but more importantly, let them understand the meaning behind these data.
For example, when the progress bar shows that the progress is behind schedule, employees need to know which link has a problem, whether it is equipment failure or material shortage.
When the equipment status icon shows a red alarm, managers need to know what measures to take to solve the problem.
In addition to technical training, a “data-driven” cultural atmosphere should be created in the factory. Just like planting a tree, it has to start from the roots.
Management should take the lead and cultivate employees’ habit of actively paying attention to the display screen data through training, publicity, and incentives.
For example, front-line employees can adjust operating parameters in time according to the quality data on the display screen to reduce the defective rate.
Managers can reasonably allocate resources according to the progress data to improve production efficiency.
Once this cultural atmosphere is formed, employees will actively use data to optimize their work instead of passively waiting for instructions.
4). Continuous optimization and improvement
Implementing visual management of LED display screens is not a “one-shot deal”, but a process of continuous optimization.
Just like driving, you have to constantly adjust the direction to reach your destination. Regularly evaluate the use of LED display screens to see what is done well and what is still room for improvement.
For example, you can regularly collect feedback from managers and employees to see what suggestions they have on display content and display methods.
If you find that a certain data display is not intuitive enough or a certain data is not very helpful for production, you can make timely adjustments.
As production needs change, the display content must also be continuously optimized.
For example, if a factory launches a new product and the production process changes, it is necessary to add new display content to the LED display screen or adjust the layout of the existing content.
In addition, with the development of technology, the functions of LED display screens are also constantly upgrading, such as higher display resolution and support for more types of graphical displays.
Factories can use these new technologies to further improve the practicality and user experience of LED display screens.
In short, continuous optimization and improvement are the keys to keeping the LED display visual management system alive.
Only by constantly adjusting and optimizing according to actual conditions can this system truly become a good helper for factory production management, rather than a “vase”.